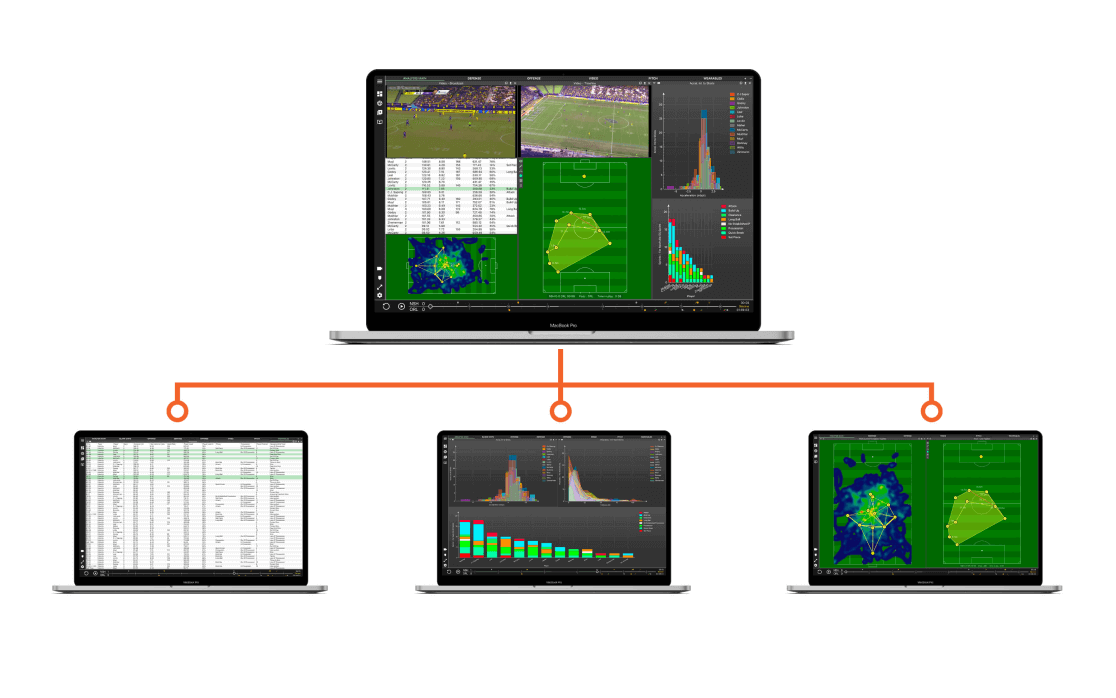
How teams get more precise performance insights in MatchTracker
In February, we released the industry’s first integrated performance data + video analysis solution. Since then, many teams have adopted this latest integration to unlock new contextual insights into their player’s performance. This blog recaps our recent webinar hosted by Catapult’s Senior Product Manager Adam Chovan and Associate Product Manager Madie Bogosian, titled ‘How to get clearer performance insights with dynamic filters & visualizations’.
In this webinar, Adam and Madie demonstrate basic, moderate, and advanced analytics found within the new integrated solution. They also review the latest feature updates in MatchTracker which allow teams to quickly filter & visualize performance insights.
We’ve answered the top questions from this webinar to get you up to speed. You can view the full webinar below.
How does MatchTracker work without the need for coding?
For the first 5 minutes of the use case section of the webinar, Madie walks us through how easy it is to extract insights using multiple performance datasets. This is shown through the adding of Columns and Filter Columns. Once data is properly filtered, teams can use the Filter Dialog to visualize this data in a variety of ways including Chart or Pitch views. While this could be seen as a basic workflow, showing how easy it truly is to sort & filter multiple datasets is a powerful way to quickly uncover insights. 
What advanced features will you learn about in this webinar?
The features presented in this webinar help Analysts get to their insights even faster. These include the following filters & visualizations:
- Cloning
- Bounding Box
- Opposition in front
- Custom, Start, and End Zones
- Drag and Drop
- and much more.
Some features will be more useful than others. This, of course, can be discussed with one of the Customer Success team members once you have the video solution in hand. To speak to the team about which features are most useful for your team, click here.
How does integrated performance data + video work in practice?
The webinar wraps up with Adam demonstrating key used cases of how teams can extract contextual insights by integrating their athlete data into MatchTracker.
Here are the key analysis workflows presented:
- Viewing sprint data across multiple players
- Filtering sprint data with Max Velocity to understand the context to match outcomes
- Collecting insights to create presentations
- Sharing insights & presentations to your entire team
At Catapult, we believe this solution, which seamlessly syncs wearable data with MatchTracker, the most powerful video analytics application for top-tier teams, is the future of professional team analytics.
Watch the webinar to learn more about Catapult’s integrated performance data + video analysis solution.
To learn more about this integrated solution:
- Visit our product page
- Read out latest blog: Introducing integrated analytics.
- Schedule a demo with one of our video experts.
- Download our free brochure: Click here.
Everything you need to know about performance analysis for 2023
More than 50 performance practitioners attended a recent conference from across Europe, including analysts from the Premier League, Bundesliga, world-renowned universities, and sports like Formula 1.
The conference focused on the innovation surrounding performance analytics in sports with the aim to educate practitioners on today’s innovative technologies and leading workflows. To discover more about performance analysis in 2023, click here.