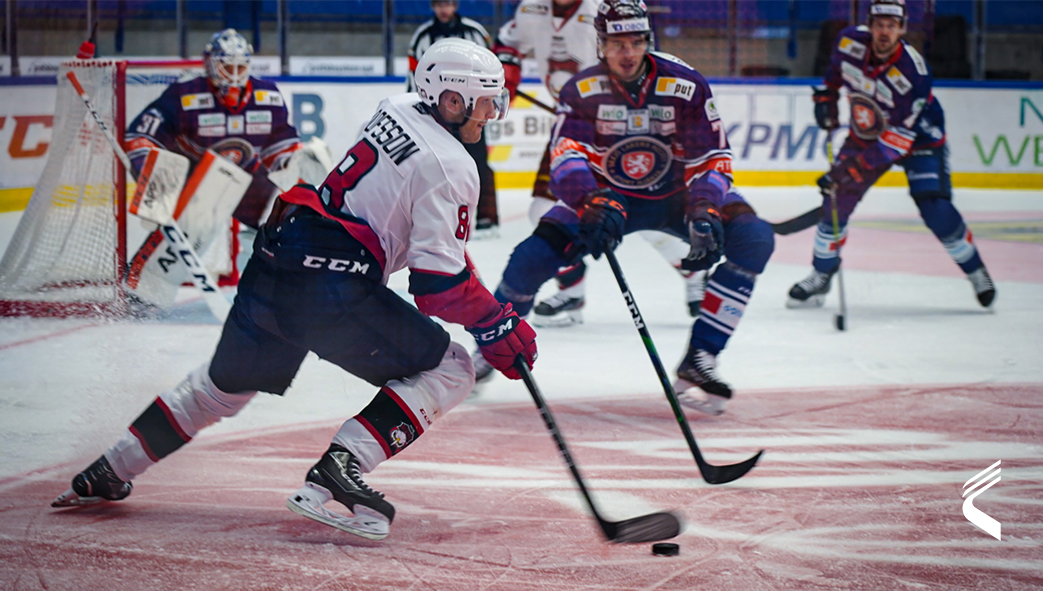
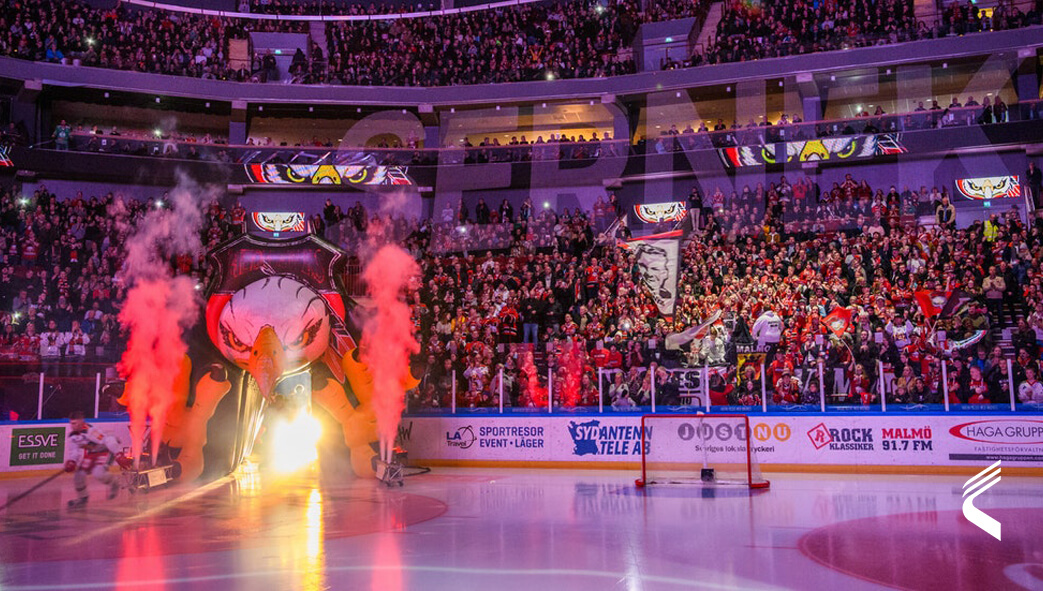
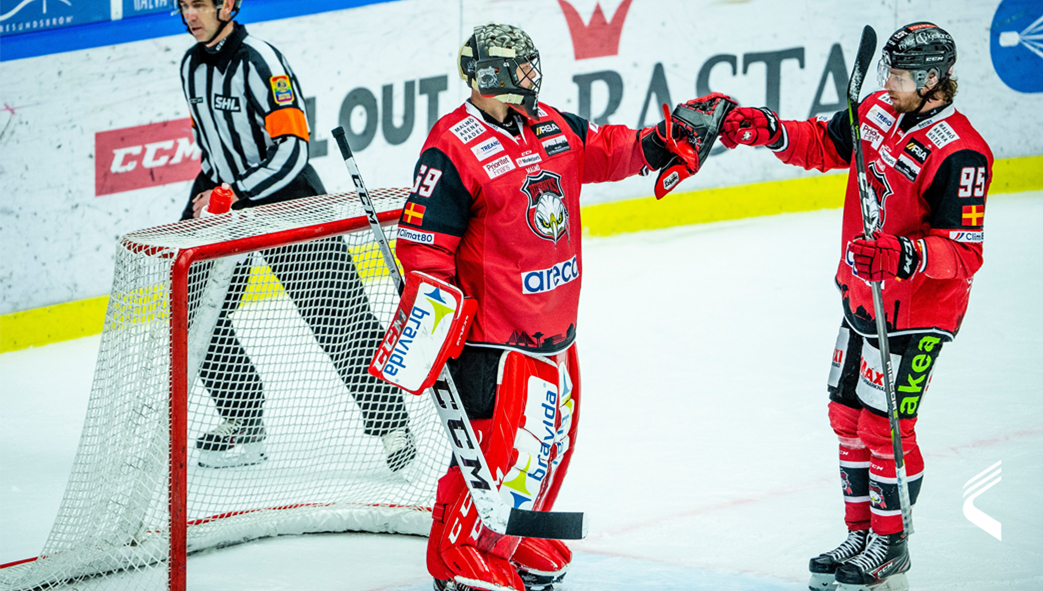
Malmö Redhawks
Ice hockey teams from around the world, and especially those outsides of North America, are seeking to understand the true demands of the sport.
By working with more than 75+ teams in the National Hockey League (NHL) and other world-leading leagues, Catapult has built up great relationships with elite coaches to help them understand the demands of hockey.
This user story discusses:
- The pioneer of hockey on-ice monitoring
- Key measured metrics to understand athletes’ demands
- Outcomes of data insights
Catapult and the Malmo Redhawks have worked together for more than five years. We recently caught up with their well-known strength and conditioning coach Freddie Sjögren, to see how the team uses Catapult’s hockey-specific technology.
The pioneer of hockey on-ice monitoring
Sjögren’s career didn’t start in hockey, so in the first stages of his relationship with Catapult, he used the technology to “to learn and understand the demands that are placed on athletes. Monitoring in hockey didn’t exist at the time and Catapult was the first to present a clear on-ice picture of performance.”
“Our main goal was to have data and a platform to communicate from, making sure our teams (coaching, performance, and medical) were working collaboratively. Catapult enabled us to do that from the start.”
Working in a European sports team means staff often speak different languages. The Redhawks found it difficult to communicate across teams effectively, but data was the solution.
“The Catapult data means that all our teams are talking the same language. It is easy to visualise and explain the insights we gain and need to deliver to take our performance to the next level,” explains Sjögren.
Key measured metrics to understand athletes’ demands
Hockey is unique and there is limited crossover with other well-known sports like American football, soccer, and rugby. But Sjögren is able to improve his understanding of hockey performance with Catapult Vector’s 45 hockey-specific metrics.
Vector enables the Redhawks’ performance team “to build a detailed picture. We collect an athlete’s skating symmetry, total work bouts, skating load, and much more,” mentions Sjögren.
If you’re looking to start monitoring your athletes on-ice, Sjögren says, “start with PlayerLoad for load calculation. Next, on-ice load per minutes and explosive ratio for intensity, and then finally, average force/stride to detect deviating skating patterns. Less is more, don’t try to dig too deep when starting. Instead, start with the basic monitoring and go from there.
Catapult’s Customer Success team (a global team of experienced performance practitioners and product specialists who deliver comprehensive set-up and training) have “helped greatly through my own education in data and monitoring, so I can highly recommend them for those just starting out. Catapult are always there if you have a question right from sports science to maximising your use of their technology. They are awesome!”
Outcomes of data insights
Technology and data in hockey empowers your performance decisions centred on athlete safety, injury prevention, and recruitment. Although, the strength and conditioning coach explains the team’s communication is where they have seen the most benefit.
Through using data, and establishing a base language for communication, “it has helped us stay away from overuse injuries and keeping our athletes on-ice and away from the recovery table,” says Sjögren.
“This outcome has built trust between our teams, coaches, and, most importantly, athletes. They now trust that what we tell them is going to better them.
“Our athletes want the team to move forward and improve and have become really interested in their data and the intensity of practice and games. They have really bought in.”
Get in touch so you can learn more about Catapult’s solutions for ice hockey, click here.
/// More hockey content for you
- Hockey-specific: Inform key decision with objective data
- Solution: Catapult’s wearable solution
- User story: University of Maine
- Webinar: Using Wearable Technology in Ice Hockey